visu::tool is a data visualization software for PCs and notebooks that reads con::lyte or con::cube output files and displays them in configurable graphs. With this new offline software tool, it is very convenient to visualize huge amounts of data (.log, .par, .csv, .xls and .fp files) into single or multiple graphs.
visu::tool – Free data visualisation and analysis tool

Details
The visu::tool “lyte” version (for reading out the con::lyte data logger or post-processing of con::cube data) is available for free on the customer portal. The advanced visu::tool “pro” version includes a vast amount of useful offline features such as data aggregation, fingerprint plots, parameter correlation and is now available for sale.
visu::tool lyte – data visualization and analysis tool:
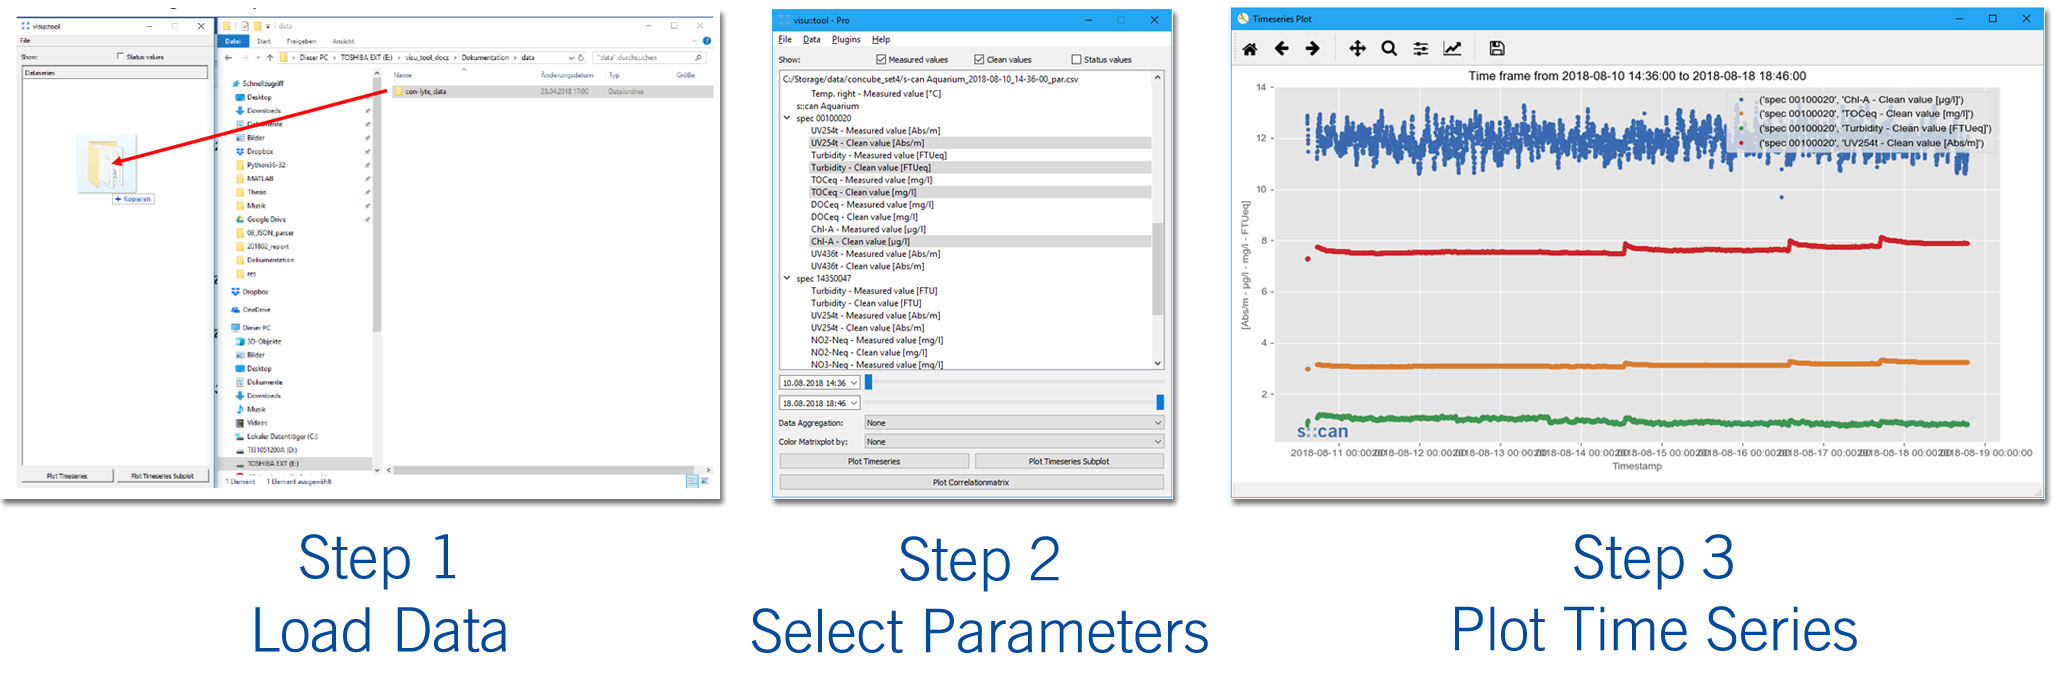
- Read con::cube (moni::tool), con::lyte, ana::pro und visu::tool output files through a convenient “drag-and-drop” user interface
- Filter loaded data to show parameter status columns or hide them
- Select any number of parameters and plot them in one line graph, or
- Plot them each in a separate graph
- Plot status codes along with parameter data
- Created graphs can be saved as images, copied and pasted to Word and are allowed for zooming and customization
- Select any number of parameters and get their statistics to copy and paste them in Excel
- Safe all loaded parameters to an Excel file, or
- Safe only selected parameters to an Excel file
visu::tool pro – advanced data visualization and analysis tool:
- All features from the “lyte” version
- Filter loaded data for measured values and/or clean values
- Slider bars for data filtering along the time axis before plotting a graph
- Data aggregation functions to plot hourly, daily, weekly and monthly values
- Plot status codes along with parameter data
- Plot fingerprints
- Select parameters and correlate them in a correlation matrix
- Optionally you can choose to plot your correlations ordered by color to detect drifts or other time dependent effects
Customizations:
- Talk to our Sales Team to obtain the “pro” version, or a free trial for it
- Customer specific features, such as a special types of graphs, or even small reports can be implemented on demand
In case you have any questions, please feel free to contact us anytime at sales [AT] s-can [DOT] at. (最终打开一个程序以向收件人'sales@s-can.at.'发送电子邮件)